

Processing Functions > The Process Histogram Command
|
|
The Process Histogram Command
The Process Histogram command is used to adjust the contrast, brightness and gamma of the image by manipulating its histogram. The Histogram command brings up the Histogram Dialog.
The Histogram dialog displays a graph of the number of pixels at each pixel value versus pixel value. Superimposed on the histogram is the "transfer function" which shows the mapping of input gray values (along the horizontal axis) to output gray values (along the vertical axis). The red markers on the histogram can be moved by dragging them with the mouse. To increase the contrast, you move the left and right markers towards each other. This changes the transfer function so that the indicated portion of the input range is mapped into the whole output range. Similarly, to reduce contrast, move the top and bottom markers closer together. This maps the whole input range into the indicated portion of the output range. To adjust the gamma, move the middle marker.
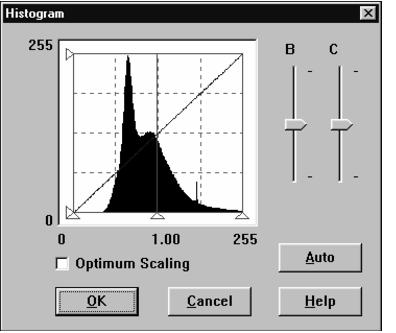
The B and C sliders are used to adjust the Brightness and Contrast respectively. The same effect can be achieved by moving the red markers on the histogram. The sliders are provided as a convenience to the operator.
The Auto button examines the histogram and automatically adjusts the left and right markers to coincide with the first and last non-zero values in the histogram.
The histogram plot may be scaled in two different ways. When the Optimum Scaling check box is not selected, the histogram is scaled so that the top of the plot corresponds to the maximum bin value. In many cases, the image contains large black or white areas and the black or white bin in the histogram is much larger than any other bin. If the histogram is scaled according to this maximum bin, the rest of the histogram will be drawn very flat and much useful information will be lost. By selecting Optimum Scaling, the histogram will be scaled according to a multiple of the average bin value thereby presenting more useful information. Bins that overflow when Optimum Scaling is selected are displayed in bright green.
|
|